Alteryx, Tableau, and UFOs
Today I was challenged to find an open data set and play around with blending the data using Alteryx, a self service data blending and analytics tool. I installed and setup the 14 day trial to get started. I usually learn best by jumping right in.
Alteryx
Alteryx does have an OS agnostic web app that you can use for the trial, but I decided to use their full featured desktop application. It’s only available on windows…SAD! Good news though, it runs well in my Win7 virtual machine.
It’s a fairly intuitive tool to use, I only needed to watch a short Youtube video to get familiar with the basic workflow, from there I was able to figure out the different functions of each node by playing around. If you’ve ever done ETL work in Datastage, it’s very similar.
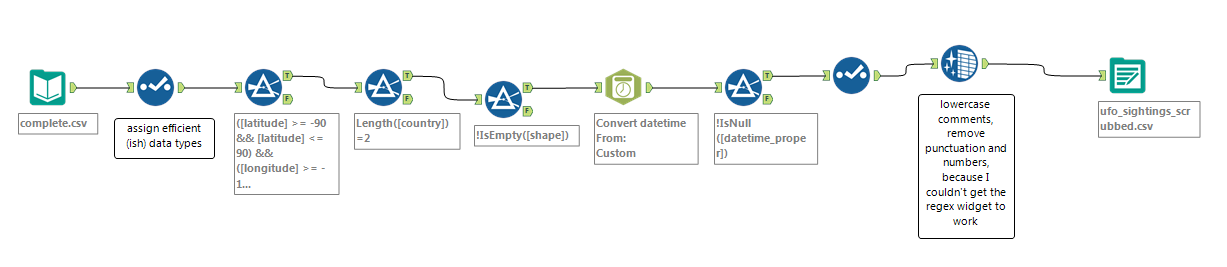
After a couple hours of messing around, I came up with this simple data scrubbing workflow that takes in the “raw” UFO sighting data I downloaded from Kaggle, and spits out a nicely formatted .csv file that I can then import into Tableau. Alteryx can output directly to a Talbeau Data Extract file, but alas… I can’t use that filetype on public.tableau.com.
Here’s a pic of my workflow.
If you’re interested in my Alteryx workflow, you can download it from here
here’s my scrubbed UFO file if you want to see how it got cleaned.
While this tool is very intuitive to use for the most part, I struggled to get a basic regular expression node to work, and the expression itself wasn’t that complicated.
Another thing to point out is how much the licensing fee is! Holy Cow!
The most frustrating thing for me is that most of this software is just providing a GUI wrapper for most of R’s built-in functions and common libraries. So if you have the right technical chops, you can easily develop your own R script that can handle all your ETL, Blending, and light visualizations, all without the expensive licensing fee. Not to mention the stability from being a mature, open source project.
Tableau
I purchased a Udemy course in the past and have already gone through most of it. I’ve made a couple dashboards in the past, but they were nothing spectacular… and these new visualizations aren’t too far off.
I loaded my csv file into Tableau and starting playing around with the data, seeing what kind of visualizations would be possible with this data. I had a bit of a struggle since it has been a while since I’ve used it, but I was able to hobble something together in a reasonable amount of time.
Here’s my findings from playing around with this dataset. I apologize for the small pictures, public.tableau.com doesn’t let you export images of your charts, so I had to use screenshots.
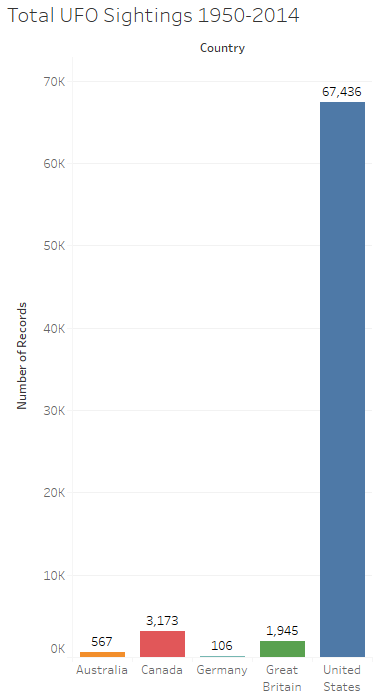
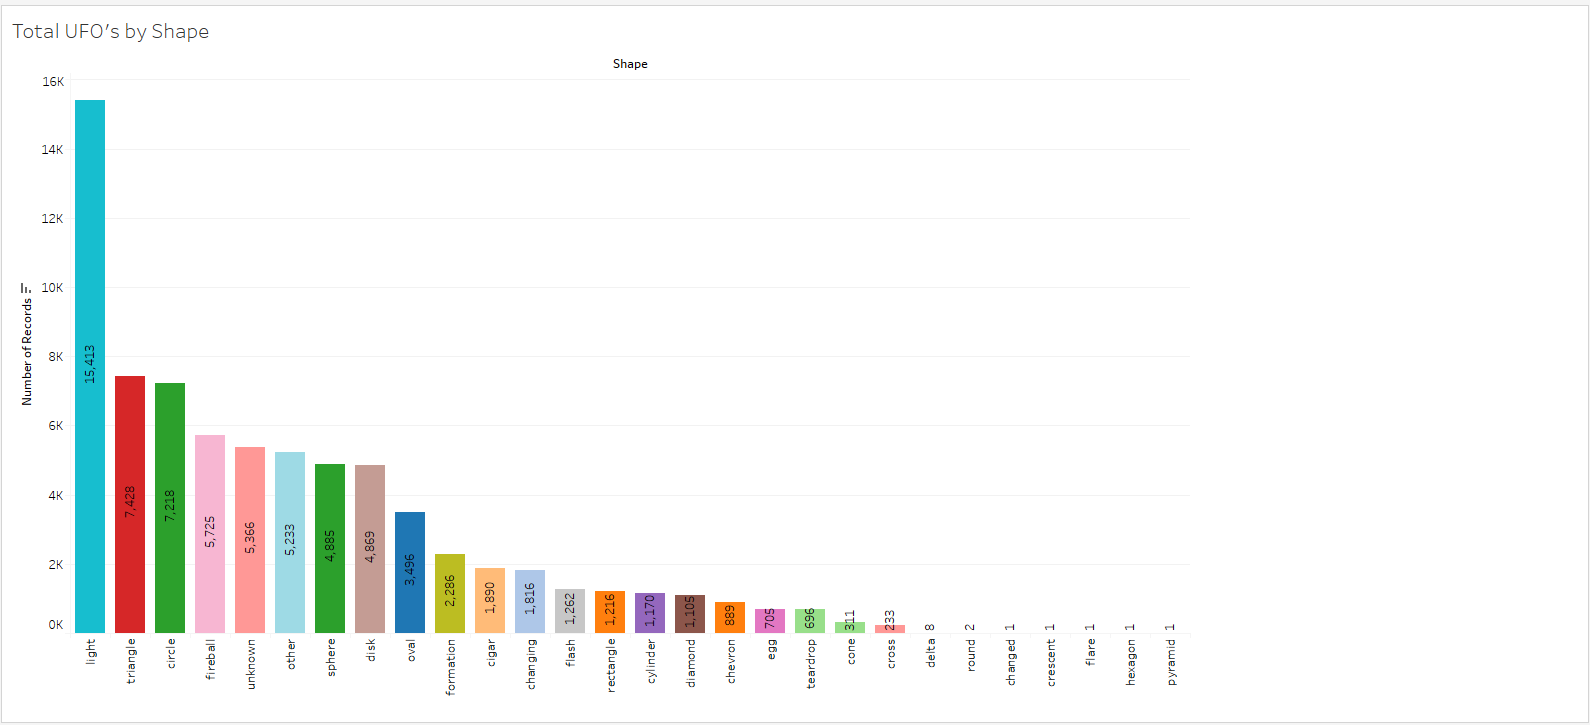
The US has been killin’ it at finding unknown flying stuff
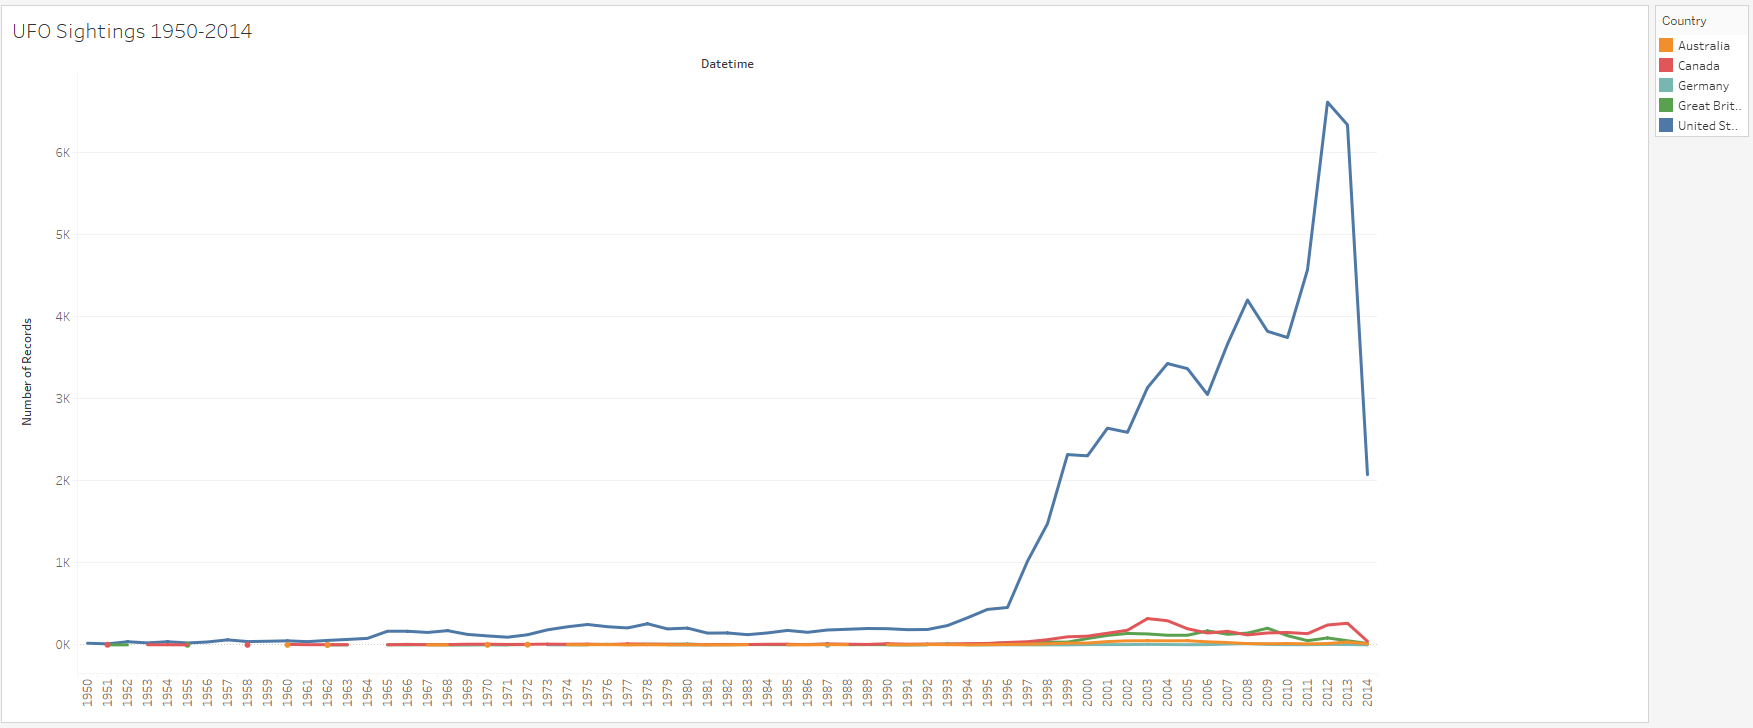
This data set only goes to 2014, but there was a significant drop that year. I’m curious as to why.
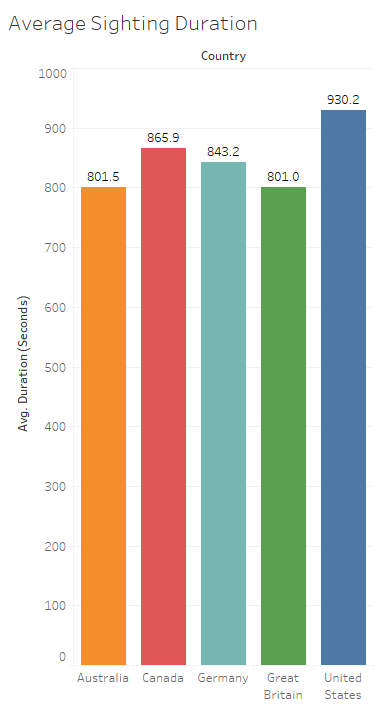
The average duration for each sighting was pretty similar between countries.
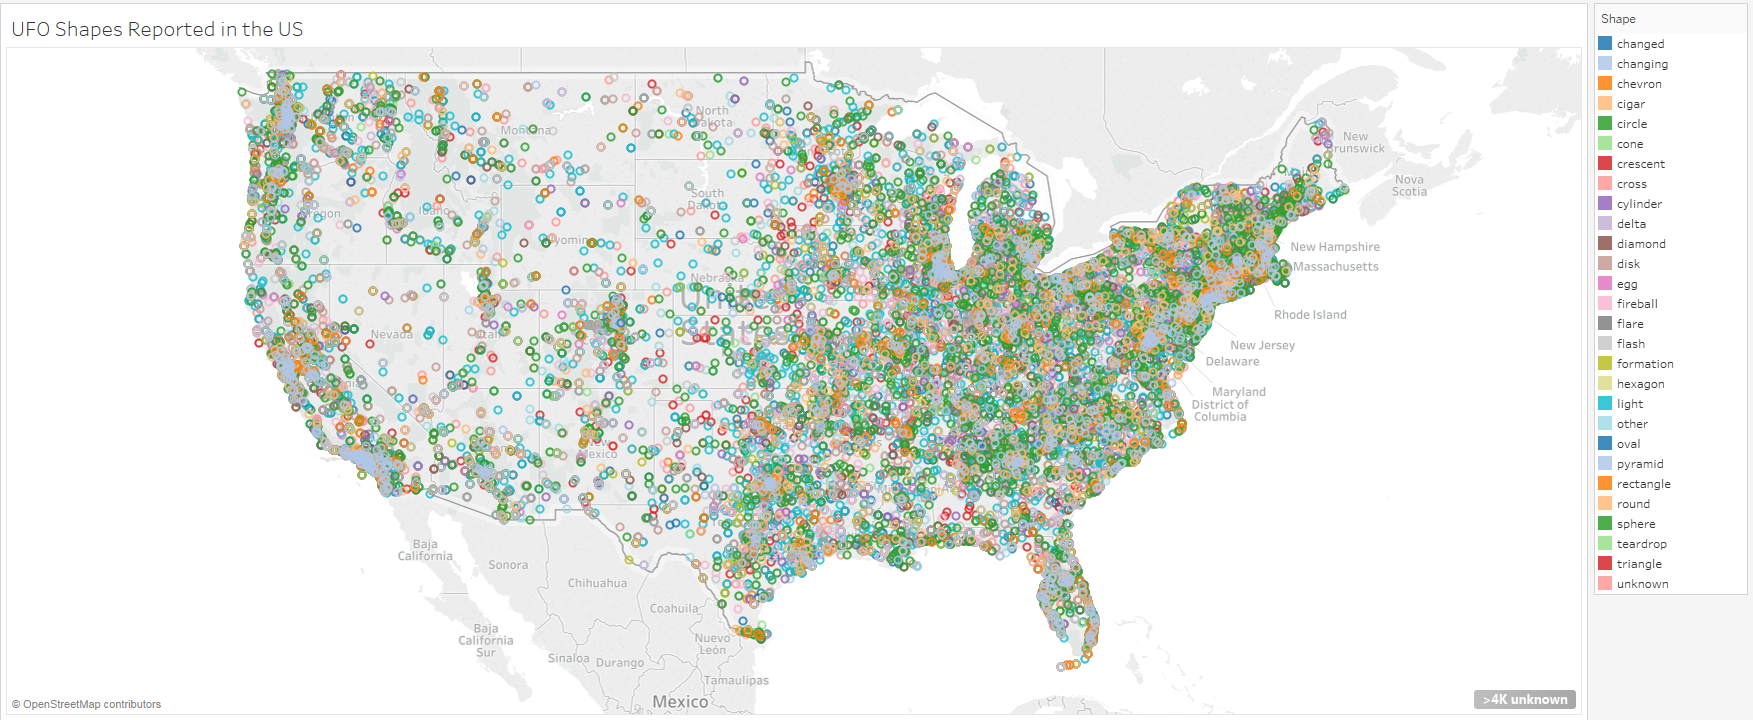
I admit this is pretty messy, but shows how varied all these sightings have been.
I don’t have a closing statement for this post… it’s late and my fingers are getting cold and slow. Thanks for reading.
